Unit 5 comparing linear quadratic and exponential functions – In this comprehensive guide to unit 5: comparing linear, quadratic, and exponential functions, we delve into the intricacies of these fundamental mathematical concepts. By exploring their distinct characteristics, similarities, and applications, we gain a deeper understanding of the diverse roles they play in modeling and analyzing real-world phenomena.
Throughout this exploration, we will unravel the concepts of linear functions, quadratic functions, and exponential functions. We will examine their equations, graphs, and key features, including slope, y-intercept, vertex, axis of symmetry, base, and growth rate. This in-depth analysis will provide a solid foundation for comparing and contrasting these functions, enabling us to recognize their unique strengths and limitations.
Comparing Linear, Quadratic, and Exponential Functions: Unit 5 Comparing Linear Quadratic And Exponential Functions

Functions are mathematical expressions that relate two variables, typically an input variable (x) and an output variable (y). Different types of functions have unique characteristics and are used to model different types of relationships. In this article, we will explore and compare three common types of functions: linear, quadratic, and exponential functions.
Linear Functions
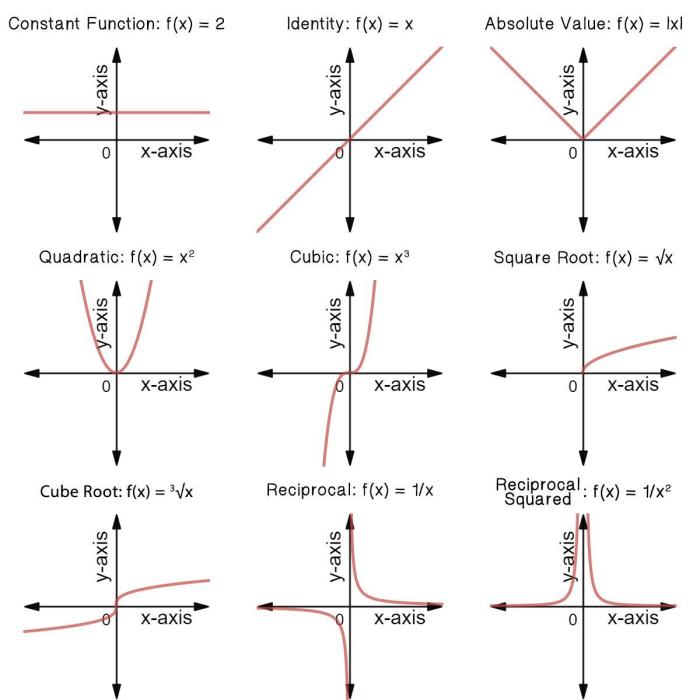
Linear functions represent a straight line on a graph. They are characterized by a constant rate of change, known as the slope. The equation of a linear function is typically written in the form y = mx + b, where m is the slope and b is the y-intercept (the value of y when x = 0).
- Examples:y = 2x + 1, y = -3x + 5
- Slope:The slope indicates the steepness of the line. A positive slope represents an increasing line, while a negative slope represents a decreasing line.
- Y-intercept:The y-intercept is the point where the line crosses the y-axis.
Quadratic Functions
Quadratic functions represent a parabola on a graph. They are characterized by a quadratic equation of the form y = ax^2 + bx + c, where a, b, and c are constants. The shape of the parabola is determined by the coefficient a.
- Examples:y = x^2 – 4, y = -2x^2 + 3x + 1
- Vertex:The vertex of a parabola is the point where it changes direction. It is given by the coordinates (h, k), where h = -b/2a and k = f(h).
- Axis of Symmetry:The axis of symmetry is a vertical line passing through the vertex and divides the parabola into two symmetrical halves. It is given by the equation x = h.
Exponential Functions
Exponential functions represent a curve that increases or decreases rapidly. They are characterized by an equation of the form y = a^x, where a is the base and x is the exponent. The base determines the rate of growth or decay.
- Examples:y = 2^x, y = e^x (where e is the natural base approximately equal to 2.718)
- Base:The base represents the factor by which the output is multiplied at each step.
- Growth Rate:The growth rate is determined by the base. A base greater than 1 represents exponential growth, while a base less than 1 represents exponential decay.
Comparing Linear, Quadratic, and Exponential Functions, Unit 5 comparing linear quadratic and exponential functions
| Characteristic | Linear | Quadratic | Exponential |
|---|---|---|---|
| Graph | Straight line | Parabola | Curve |
| Equation | y = mx + b | y = ax^2 + bx + c | y = a^x |
| Slope | Constant | Varies | N/A |
| Vertex | N/A | (h, k) | N/A |
| Growth/Decay | Linear | Parabolic | Exponential |
Similarities:Linear, quadratic, and exponential functions are all used to model real-world phenomena. They can all be used to predict future values based on past data.
Differences:Linear functions represent a constant rate of change, quadratic functions represent a parabolic shape, and exponential functions represent rapid growth or decay.
Applications of Linear, Quadratic, and Exponential Functions
- Linear Functions:Modeling population growth, predicting sales revenue, calculating distances
- Quadratic Functions:Modeling projectile motion, designing parabolic structures, approximating the area of a circle
- Exponential Functions:Modeling population growth with limited resources, calculating compound interest, describing radioactive decay
Modeling with Linear, Quadratic, and Exponential Functions
Functions can be used to model data and make predictions. Linear functions can be used to model data that shows a constant rate of change. Quadratic functions can be used to model data that shows a parabolic shape. Exponential functions can be used to model data that shows rapid growth or decay.
FAQ
What is the key difference between linear and quadratic functions?
Linear functions have a constant rate of change, while quadratic functions have a rate of change that changes at a constant rate.
How can I identify an exponential function?
Exponential functions have a constant base raised to a variable exponent.
What is the practical significance of comparing linear, quadratic, and exponential functions?
Comparing these functions allows us to choose the most appropriate function for modeling and analyzing different types of data and phenomena.


